
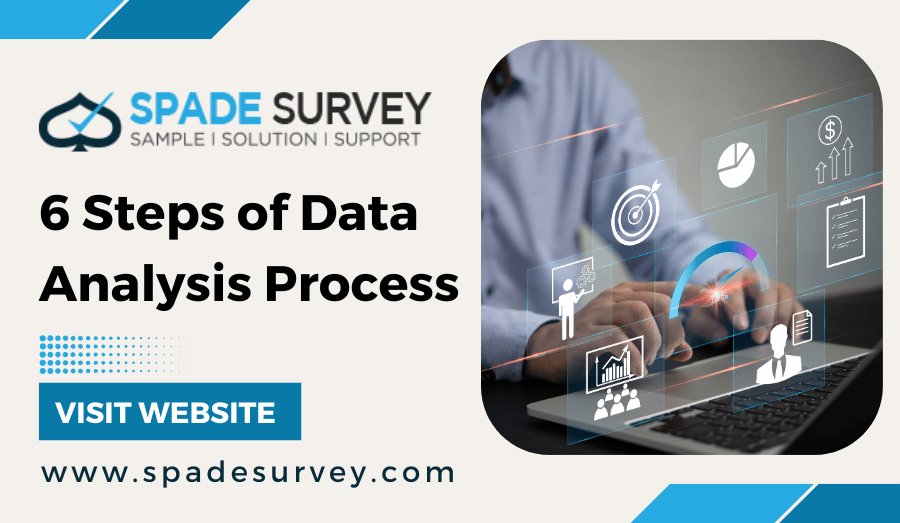
Six Steps of Data Analysis Process
Data analysis is an essential component of company operations, comprising a diverse range of complicated and technical activities.
Six data analysis processes will assist you in making informed decisions: inquire, prepare, process, analyze, share, and act. Remember that they are distinct from the data life cycle, which explains the changes that data experiences over its existence.
Let’s go over the steps and see how they can assist you address challenges on the profession. This blog gives a full explanation of the data analysis process, including the important processes and recommended practices at each stage.
Steps for the Data Analysis Process:
Step 1: Define the Question
In the first phase of the process, the data analysis is assigned a problem/business job. The analyst must grasp the task and the stakeholder’s expectations for the solution. A stakeholder is someone who has invested their money and resources in a project. The analyst must be able to ask several questions in order to identify the best solution to their situation.
To effectively understand the problem, the analyst must first identify its fundamental cause. The analyst must avoid distractions while examining the situation. Effective communication with stakeholders and coworkers is essential for fully understanding the underlying problem. Questions to ask yourself during the Ask phase are:
- What are the challenges raised by my stakeholders?
- What are their expectations for the solution?
Step 2. Data Collection
The second phase is to prepare or collect data. This process entails collecting and storing data for future analysis. The analyst must collect data from numerous sources in accordance with the assignment assigned. Data must be obtained from a variety of sources, both internal and external.
Internal data is available within the organization for which you work, whereas external data is available from sources other than your organization.
– First-party data refers to data obtained by an individual using their own resources.
– Data acquired and sold is referred to as second-party data.
– Third-party data refers to data obtained from outside sources.
Data is commonly acquired through interviews, surveys, feedback, and questionnaires. The collected data can be saved in a spreadsheet or SQL database.
Step 3: Cleaning the data
After you’ve collected your data, the next step is to prepare it for analysis. This implies cleaning, or’scrubbing’ it, which is critical for ensuring that you’re working with high-quality data. Important data cleansing tasks include:
– Eliminating severe errors, duplication, and outliers — all of which are unavoidable issues when combining data from many sources.
– Eliminating unnecessary data points — extracting useless observations that have no influence on the intended analysis.
– Adding structure to your data — general ‘housekeeping’, such as addressing typos or layout flaws, to make it easier to map and handle your data.
– Filling in large gaps — as you clean up, you may discover that vital data is missing. Once you’ve found gaps, you can start filling them.
Step 4: Analyzing the data
Finally, you have cleared your data. Now comes the fun part: analyzing it! The type of data analysis you perform is primarily determined by your goals. But there are numerous techniques accessible. Some of the terms you may be familiar with include univariate or bivariate analysis, time series analysis, and regression analysis. More important than the different varieties is how you use them. This depends on the insights you want to get. Generally speaking, all sorts of data analysis fall into one of four categories.
Step 5. Data Visualization
The fifth phase is visualizing the data. Nothing is more captivating than a visualization. The altered data must now be represented visually. The reason for creating data visualizations is that there may be people, primarily stakeholders, who are not technical. Visualizations are created to simplify the interpretation of complex data.
Tableau and Looker are the two most popular tools for creating stunning data visuals. Tableau is a simple drag-and-drop tool for producing attractive representations. Looker is a data visualization tool that connects directly to a database and generates visualizations.
Step 6. Presenting the Data
Presenting data is putting raw information into a format that is easily understandable and meaningful to many stakeholders. This technique includes creating visual representations, such as charts, graphs, and tables, to effectively communicate patterns, trends, and insights derived from data analysis.
The goal is to make difficult material clearer and more accessible to both technical and non-technical audiences. Effective data presentation necessitates a careful selection of visualization techniques based on the nature of the data and the precise message desired. It progresses from plain display to storytelling, in which the presenter analyzes the findings, emphasizes significant aspects, and leads the audience through the narrative as the data unfolds.
Whether through reports, presentations, or interactive dashboards, the art of presenting data entails striking a balance between simplicity and complexity, ensuring that the audience understands the relevance of the information offered and can utilize it to make informed decisions.
How Spade Survey Helps:
Data is the foundation of any business seeking to develop through digital transformation. From uncovering new business possibilities to mitigating risks, data analysis transforms raw data into actionable insights, giving you a strategic advantage.
Data analysis is an essential component of company operations, comprising a diverse range of complicated and technical activities. Outsourcing data analysis services in India to our skilled team might result in strategic corporate insight and informed decision-making. We employ advanced techniques to evaluate massive amounts of unstructured and structured data, resulting in deep and relevant insights that go beyond mere descriptive statistics. Our data analysis services for small businesses are specifically designed to provide high-value insights that promote growth and competitiveness.
We recognize the sensitivity of your company data and strictly comply with worldwide data protection requirements. Our strong data governance policies ensure that your data is always confidential, secure, and available. By outsourcing your data analysis to us, you benefit from our technical experience, innovative solutions, and secure processes.
Contact us right away to benefit from our innovative data analysis services and obtain a competitive advantage in your industry. Use our data analysis services to make better use of data. We can assist you with collecting, storing, cleansing, visualizing, analyzing, and exploring massive datasets to discover hidden patterns and significant insights.
Conclusion:
In this article, we reviewed the key processes in the data analytics process. These essential processes can be modified, rearranged, and reused as needed, but they serve as the foundation for all data analysts’ work.
The data analysis process is a critical framework that transforms raw data into actionable insights in six steps: problem definition, data collection and cleaning, data analysis, results interpretation, and effective communication of findings.
Businesses, researchers, and decision-makers can use this organized method to identify important trends, solve problems rapidly, and make confident data-driven judgments. These methods, whether employed for market research, company strategy, or scientific studies, ensure that data-driven findings are accurate and reliable. Embracing this method enables firms to improve performance, decrease risks, and achieve success in an increasingly data-driven environment. Contact us today to discuss your project and see how our data analysis services may help you make smarter business decisions.